You can find all existing blog posts as well as new posts on naledi.co.uk/blog


You can find all existing blog posts as well as new posts on naledi.co.uk/blog

Tableau provides a bunch of different filtering options to enable the functionality we need to interact with our data. However, while practical, there are very few options to customise the look of these filters. After spending a long time polishing that perfect dashboard, you want your filters to blend in seamlessly.
Instead of heading to the limited formatting options for your filter controls you can create your own filter interactions by using sheets, which give you all the customisation options normally available when building visualisations.
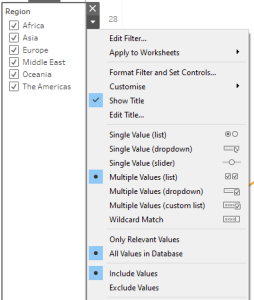
Examples of customised filters include creating legends that allow you to filter your visualisation or filtering your view using shapes. However, in both these examples multiple items can only be selected if the user holds down the shift button. That’s not a very intuitive or user friendly way to interact with a filter.
Set actions allow us to extend these examples, by allowing us to add items to a set incrementally, without having to use our keyboard to select multiple items. But what if you want to both select and then deselect items again to flexibly change what is in your view, just like with a regular multiple values filter? A set action can either add or remove from the set, not both. I want to show one way that a customised multiple select filter can be created in Tableau, using parameter actions.
IF CONTAINS([Parameter], '_' + [Region] + '_')
THEN REPLACE([Parameter], '_' + [Region] + '_', '')
ELSE [Parameter] + '_' + [Region] + '_'
END CONTAINS([Parameter], '_' + [Region] + '_')

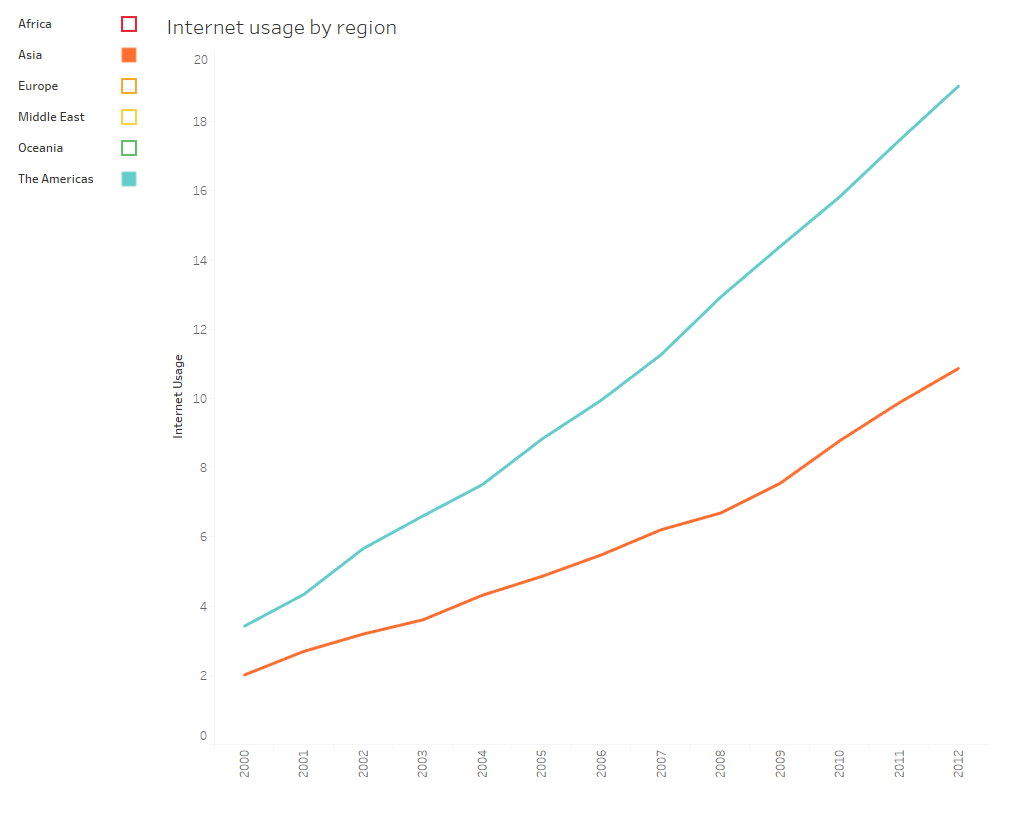
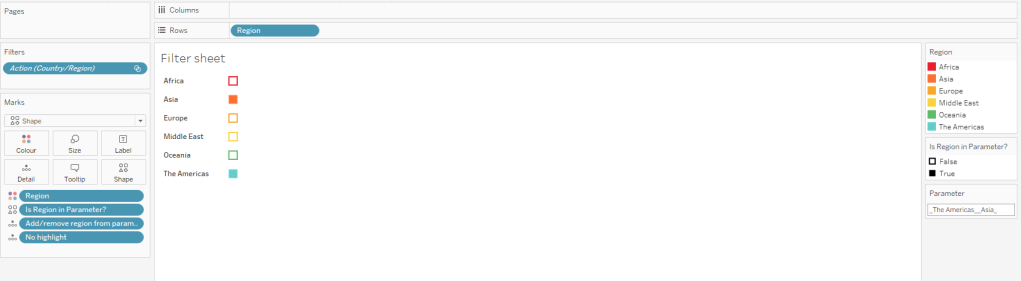
With all these steps completed I now have a filter set up that allows me to add and remove regions from my line chart, with just three calculations, one parameter and two dashboard actions. The benefit of this approach is that it works with fields that contain many different members, as we don’t have to create a calculated field or action for each individual item.
You can test out the custom filter and download the workbook on Tableau Public.

I’ve looked at a lot of job adverts aimed at Tableau Experts since finishing The Data School and many of them want you to be a SQL expert. I had placements with four different companies, of which one was a consultancy, a two-year job and several freelance projects as an analyst before I actually needed “advanced” SQL skills.
So is it worth learning SQL if you know Tableau and Alteryx? What does it mean to be a SQL expert? Do the jobs that ask for SQL experts really need them? And how do you get a job that asks for SQL experts when you aren’t one?
Not every job advert that asks for SQL experts actually needs one. I believe this is due to several factors. The first being that there is an assumption that analysts started out using SQL and Excel before they moved on to more specialised tools such as Tableau and Alteryx. For analysts that got a lot of their training on the job this might be true, but coming from a trainee programme myself, which was specialised in Tableau and Alteryx, my path looked a bit different. There simply was no need to work in Excel, and we covered SQL with just one week of training but never used it. So when HR is putting together that job description, they might feel that by adding SQL as a skill they are making sure that they get the “real analysts”.
My second theory about why SQL experts are often sought for Tableau roles is that if an organisation is new to Tableau, they haven’t quite understood yet what Tableau can do. I have seen analysts that came from a SQL background to Tableau, who were quite proficient with Tableau, still use SQL to answer ad-hoc questions. Going into Tableau to explore the data for an answer is still a different way of thinking, and doing this in SQL, with repeatedly writing out queries, is what they are used to and good at. If they are the people feeding into the job advert, then it is natural that they will believe their new team member will need the same skills, because they might not understand that you can use Tableau for the same purpose.
But that doesn’t mean they are all wrong. There will be many roles that are asking for SQL skills because the role really does need them.
The main reason why you might need SQL is automation. If you have a database, and you are connecting to this with Tableau, there might be times when the data setup required becomes too complex for Tableau. You can achieve better performance or a quicker workbook setup by forming the data into a more suitable shape. Even if your organisation uses Alteryx or another ETL tool, you will need a way to automate this, which in many cases adds significant cost and is thus not available. The quickest and cheapest way to reshape your data and support Tableau updates at the speed of your database updates is with a custom SQL query or view.
Secondly, if your team mates are all SQL experts then this is the way they will communicate with each other. You want to be able to QA their work at some point and understand what they are saying when they post queries into Slack, highlighting oddities they have discovered in the data.
Moreover, even if you are not responsible for creating tables in the database, you need to understand them, and detailed documentation is often not in place. Instead, the team might simply point you in the direction of the source query that creates the table and you will need to figure things out from there.
In my most recent role there was another reason, which is that we often didn’t provide analyses, we provided data. I could have created a Tableau workbook connected to the same data, with the same conditions and then exported the data from there. In the end Tableau is just an interface to create a data query. But this would have required my teammates to understand and check what I had set up in Tableau, which is actually more complex than interpreting someone else’s SQL query. You need to click into different calculations to see how they are set up and make sure you check if there are any workbook level filters applied. With a SQL query it’s all there in one view, which makes it easier to understand the logic behind an analysis.
Finally, it is easier and more space efficient for documentation purposes to save a SQL query in a simple txt file rather than a Tableau workbook.
Having the very basics of SQL skills is always useful as an analyst. If you are working with databases, it is good to have a little understanding of how they are set up and how you would directly interact with one if you really had to. In The Data School we did this training over the course of one week, and I’d say once you know your way around the basic structure of making a query, grouping it and adding some filters, this requirement is met. There, you can put SQL on your CV.
The next step is to determine what the job advert actually means when it asks for “expert SQL skills” and why the organisation wants them.
If you make it to the interview stage, find out some of the following:
They might use SQL to create functions in the database, that you need to understand but not be able to create yourself. Equally, at this point the interviewers might say that the team uses SQL to analyse data and find answers. You can then explain to them how you do this with Tableau and the benefits this has for you.
Perhaps they don’t do this at all, and SQL is just used to set up the database. Perhaps they constantly write custom SQL because they don’t know how to manipulate data in Tableau and this approach is easier for them. Perhaps they do this because the complex data structures mean that they need to prepare the data into the right shape because Tableau wouldn’t be able to handle it.
Try to assess if the use case is something you can circumvent with your Tableau knowledge or if what they are describing sounds like you would need to use it the same way.
SQL can be used to manage a database, by creating users and schemas and assigning roles. While rare, this might be all you need to do. SQL is also used to create data structures and to retrieve them. The knowledge needed for these different use cases is quite different, and you can be an expert in one area but known nothing about another.
Ask the interviewers to describe what they mean with those “expert SQL skills” that they are asking for. Can they give examples of commands you should know, for instance:
Their response might still not be 100% fitting to what you will actually need to do in this role, but it gives you a chance to evaluate if you think the role is suitable for you. Equally, if they can’t really answer these questions, it might be an indication that SQL skills made their way onto the job advert somehow but aren’t actually needed.
The answers you get to these questions might convince you that you don’t really want this job, and that you would rather work in a place where other tools are used. That’s absolutely fine. An interview is a two-way process.
If you do want the role, be honest about what your skills and experience with SQL are and if you believe you already know how to do the things they have just outlined or where you think you would need to learn more. The thing is, if your skills in other areas are convincing enough, they might be perfectly happy with giving you some time and support to learn on the job. Explain to them that you are willing to learn, and ideally give some examples of other things you learned, how you taught yourself and the other skills you have that will make this easier for you.
Recently, I was offered two jobs that listed advanced SQL skills as one of the requirements. I was honest with both of them about my limited SQL knowledge, and they were willing to support my learning.
I first learned a little HTML when I was a teenager, but never got very far with it. More recently, I have been in touch with it when scraping websites and my work with data visualisation has made me more interested in web development and UX/UI design. So a few months ago I decided to teach myself the basics of HTML and CSS. I managed to get to the point I wanted to within about four weeks, while working full-time and doing all of it for free.


My focus shifted from this project to strengthening my SQL skills and learning Python, so my progress has halted since step 7. Currently, after going through the steps above, I feel that I am at the stage where I can create a simple website and understand how other sites are set up. Some things that my new knowledge has helped me do:
While I am not concentrating on this path at the moment, I will definitely pick it up again in the future. There are several things that I want to concentrate on when I do, which weren’t covered sufficiently in the steps I took:
A while back I wrote about some steps you can take in order to systematically familiarise yourself with your data. Here I want to share some advice on similar approaches when creating calculations.
Creating calculations in Tableau can sometimes feel daunting when you first learn Tableau or don’t consider yourself a “data person” or a “numbers person”. Part of this is down to the invisibility of Tableau calculations. They happen somewhere in the background, off screen, and it can be difficult to tell if they are doing what you want.
If you have created a valid calculation, but it isn’t giving you the results you expect, or you need to check that it is correct, try the following two approaches.
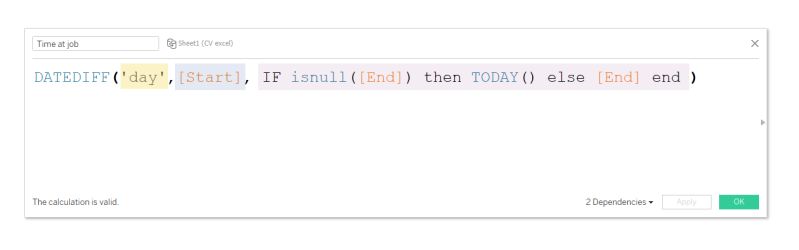
The best way to create your calculations is to watch what’s happening by creating a simple table that includes the variables that you are using. Create your calculation, drag it into the table and see if it matches up with what the result should be. If you make a change to your calculation you can simply select “Apply” to update the values in the view.
I find this helps especially with Level of Detail calculations, as you can set up the table to show the level of detail you are trying to achieve, then create your calculation and add or remove dimensions as needed to test if it still maintains the same values.
If you have a calculation that consists of multiple parts that just doesn’t seem to work the way you want it to a good way is to break it down. I tend to do this by cancelling out different parts of the calculation with the double slash or taking out one part of the calculation and pasting it into a new calculation, to check that it is doing what I expect it to.

Create your checking table as explained above, then make sure that each part of your calculation is working as it should be in isolation. Add them together bit by bit to find out at which point things are going wrong. Comments are also really useful to just leave yourself hints about what each part of your calculation is doing and are vital for documentation if anyone should take over to maintain this workbook in the future.
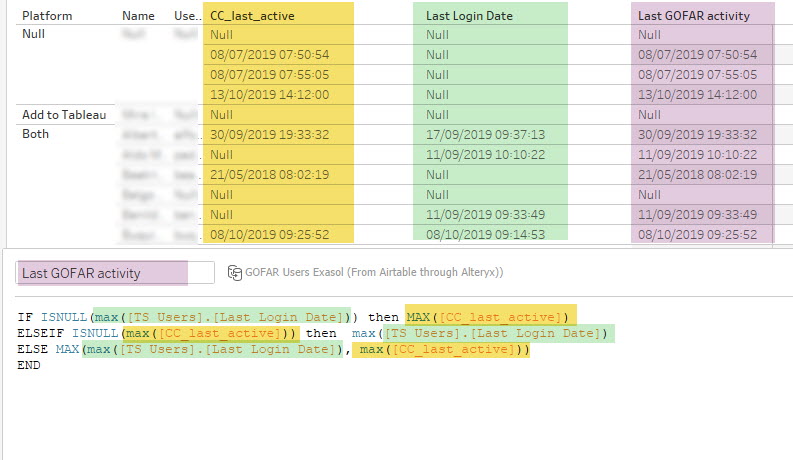
You might also choose to break down your calculation into various individual calculations and give them names that make sense to you. In my example, I could have created four calculations instead of just one.

This is a matter of preference, as individual calculations can seem less complex in this way but it requires you to switch between various calculations when you are making changes.
The two methods above helps me have confidence in my calculations and help me figure out more complex processes. It is always good practice to make sure that your calculations are doing what you expect them to, and to investigate the causes if they don’t.
What are your calculation checking best practices?
